Back

Churn Is Not a Number

Introduction

Churn is not a number – it’s a behavior. SaaS companies know the cancerous effect of churn, but often define it as a single number. Churn is typically calculated by observing the number of customers or revenue lost over a period and comparing against the beginning balance. While this approach provides a succinct headline number, such as 8% annual churn, it does not effectively explain trends in customer behavior.

Period-over-period metrics are prone to volatility and are easily skewed by exogenous variables. Inaccuracies are further compounded if the retention numbers are used to feed calculations of Expected Lifetime (eLT) and Return on Customer Acquisition Cost (rCAC). Operators seeking an accurate understanding of retention must instead segment customers by vintage-based cohorts and chart retention over time. Note, while this paper focuses on net dollar retention, the framework discussed below applies equally to gross dollar retention and logo retention.

First, let’s examine ARR “snowball” analysis. In this approach, companies calculate the sum of upsell, downsell, and churn over a period to arrive at a net dollar retention number. We refer to this as the snowball approach because the sum of net ARR retained and new logo ARR equals ending ARR balance for the period, the same way you grow a snowball by adding layers. In doing so, snowball analysis gives too much weight to the existing ARR base, obfuscating the performance of recently acquired ARR and muting time-based changes in retention performance. Similarly, snowball analysis is distorted by changes in sales velocity, outsized customer contracts, seasonality, and a host of other factors, often resulting in misrepresentation of business trends. Additionally, the snowball methodology implies that customer behavior is consistent over time, ignoring empirical evidence indicating that retention dynamics change throughout a customer’s lifecycle. To avoid these pitfalls, we recommend segmenting customers by acquisition cohort – typically monthly or quarterly – and plotting the retention of each vintage over time to see patterns that help inform operational decisions.

The concept of cohort analysis is well-established science. Imagine an actuary telling you she estimated human life expectancy by observing death counts between 1939 and 1945 and comparing that to the population at the start of the period. WWII sharply increased the number of deaths over those seven years, but we wouldn’t want to conclude that life expectancy had necessarily declined dramatically. Similarly, SaaS businesses often face shocks that snowball analysis is ill-equipped to handle.

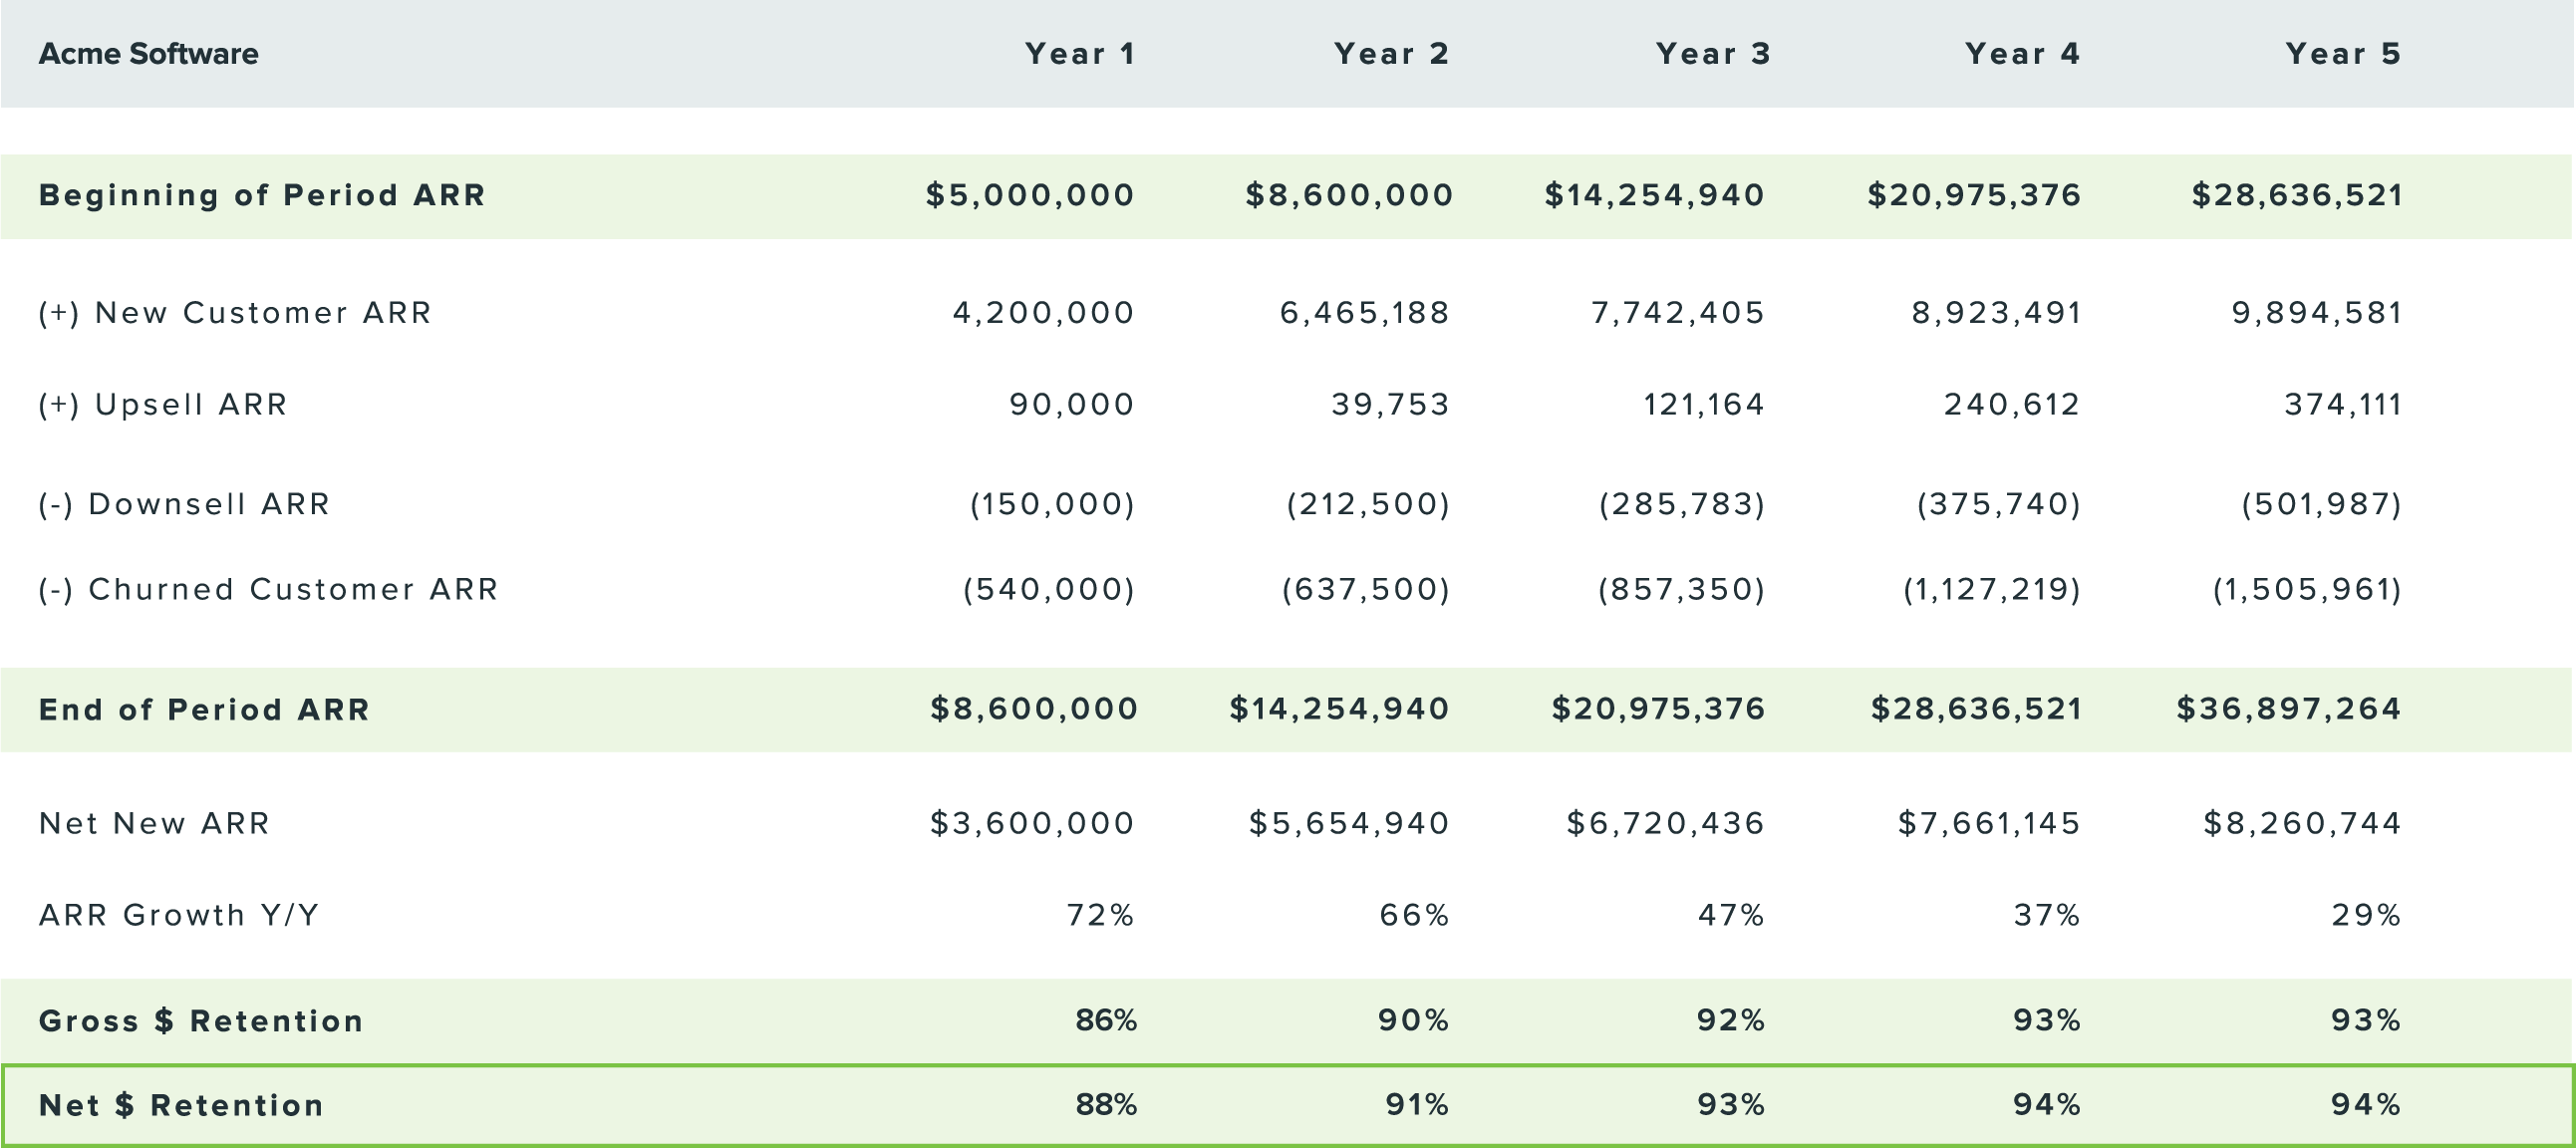
Let’s look at an example. The table below shows a popular view of retention for a hypothetical company, Acme Software.

Snowball Analysis

Acme’s snowball net dollar retention begins at 88% and steadily improves over the 5 year period, ending at 94%. Although Acme is below the coveted 100% net dollar retention level, it appears to be a healthy company trending in the right direction.

Cohort Analysis

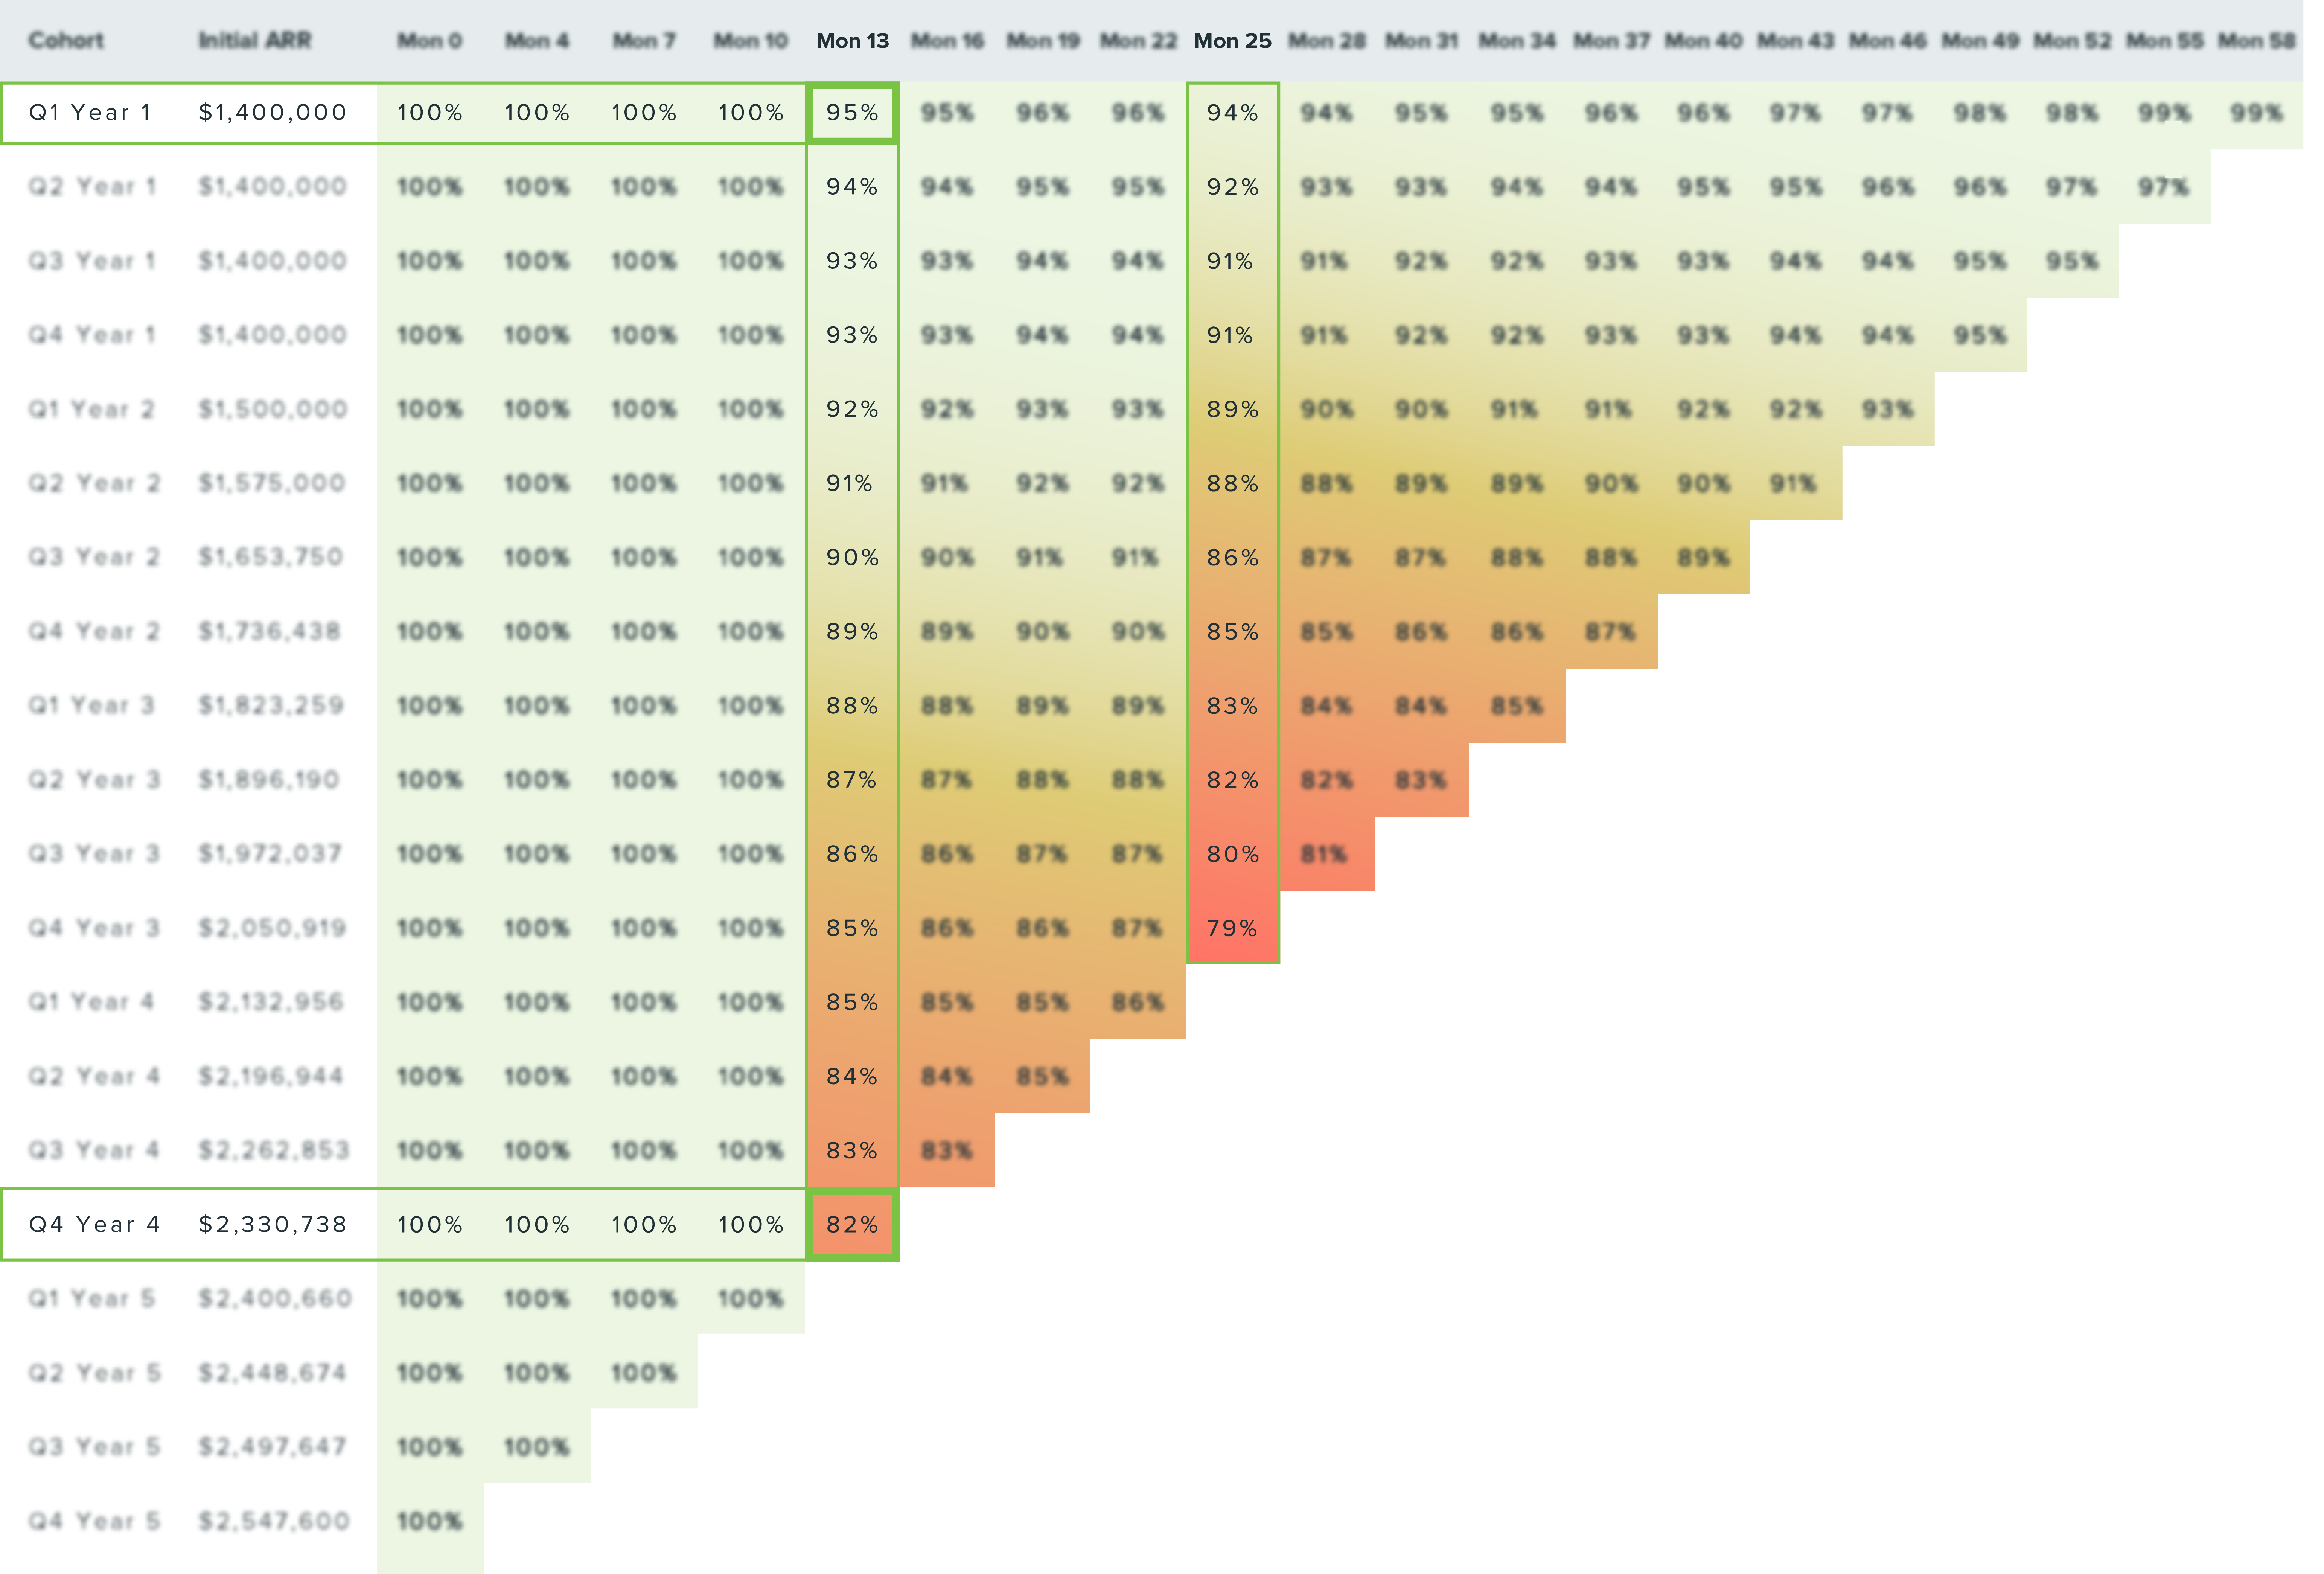
Now here is a different view of the same data, segmented by acquisition quarter and plotted longitudinally over quarterly intervals. In enterprise businesses with annual contracts, we recommend focusing on renewal cliffs – month 13 (M13), month 25 (M25), etc.. Below we can see recent cohorts eroding quickly at the renewal points. Month 13 dollar retention is 95% for the Year 1 Q1 cohort, but just 82% for customers acquired in Year 4 Q4.

Cohort Retention %

Despite the clear degradation in renewal rates, our snowball analysis showed improving retention because Acme’s older ARR base was stabilizing. As a business scales, legacy customers that are inherently stickier make up a larger and larger portion of ARR. This dynamic mutes trends in newer customer behavior, which are critically important and effective indicators of future performance. Without the cohort view, Acme’s management might be inclined to increase sales and marketing spend while being blind to an underlying product or customer success issue.

Depending on the lookback period used in snowball analysis, mismatched contract lengths can cause snowball retention to be meaningfully overstated. A common mistake is including new customers on annual deals in the beginning ARR balance when looking at monthly or quarterly snowball retention numbers. These customers will appear to retain revenue at 100% over the shorter intervals when cancelling was not even an option. The same logic applies any time contract lengths are longer than the snowball lookback period used.

While focusing on snowball retention is better than ignoring retention completely, cohort analysis yields significantly more insight. Each company has a set of unique characteristics such as time to value, upsell potential, and buyer behavior that shape retention behavior. This is further confounded by potential retention differences tied to acquisition channel, product tier, customer size, and other traits. Cohort analysis provides a granular understanding of these factors which can guide decisions to optimize performance that simply cannot be achieved with snowball analysis. As you can see, churn is indeed not a number – it’s a behavior.